[mp_row]
[mp_span col="12"]
[mp_row_inner]
[mp_span_inner col="12"]
[mp_heading]
[/mp_heading]
[/mp_span_inner]
[/mp_row_inner]
[mp_row_inner]
[mp_span_inner col="3"]
[mp_image id="3477" size="full" link_type="custom_url" link="/contact" target="false" caption="false" align="center"]
[/mp_span_inner]
[mp_span_inner col="9"]
The following information provided by the Ottawa Real Estate Board.
“We are definitely seeing a resale market increase from the previous month, with 256 more properties sold in March over February,” says President of the Ottawa Real Estate Board, Shane Silva. “Properties are starting to sell faster, indicating that we are heading into our busy spring market.”
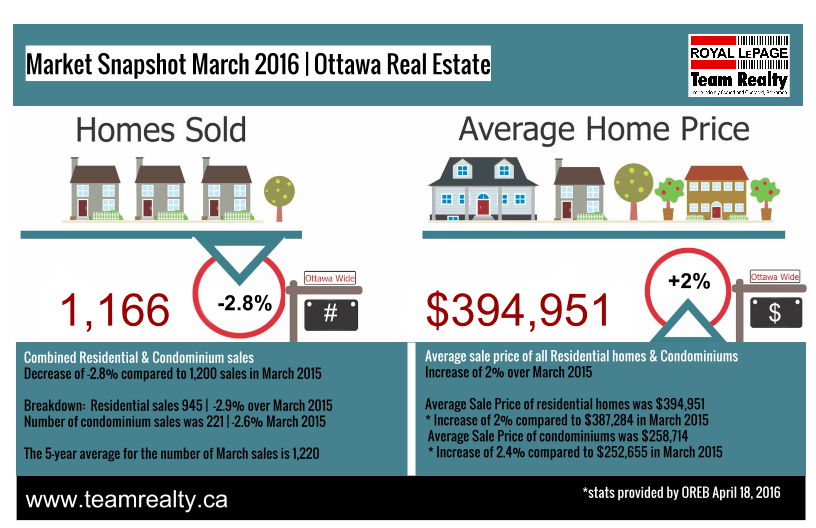
March’s sales included 221 in the condominium property class, and 945 in the residential property class. The condominium property class includes any property, regardless of style (i.e. detached, semi-detached, apartment, townhouse, etc.), which is registered as a condominium, as well as properties which are co-operatives, life leases and timeshares. The residential property class includes all other residential properties.
“In March, 3,203 homes were listed, up 38.6 per cent since February, and inventory on hand at the end of March also rose by 17.5 per cent from last month,” says Silva. “Although there is a slight dip in units sold compared to last year, average price remains steady keeping the Ottawa resale market healthy and strong. Canada’s capital continues to be a great place to buy and sell real estate.”
The average sale price of a residential-class property sold in March in the Ottawa area was $394,951, an increase of two per cent over March 2015. The average sale price for a condominium-class property was $258,714, an increase of 2.4 per cent over March 2015. The Board cautions that average sale price information can be useful in establishing trends over time but should not be used as an indicator that specific properties have increased or decreased in value. The average sale price is calculated based on the total dollar volume of all properties sold.
“The hottest segments in our market continues to be in the $300,000 to $400,000 price range, followed by the $200,000 to $300,000 price range,” says Silva. “Residential two-storey and bungalow homes, and one level condo properties have the highest concentration of buyers in March. In addition to residential and condominium sales, OREB Members assisted clients with renting 695 properties since the beginning of the year.”
[/mp_span_inner]
[/mp_row_inner]
[mp_row_inner]
[mp_span_inner col="12"]
[mp_image id="3471" size="full" link_type="custom_url" link="#" target="false" caption="false" align="center"]
[/mp_span_inner]
[/mp_row_inner]
[/mp_span]
[/mp_row]
[mp_row]
[mp_span col="12"]
[mp_text]
The Facts for March 2016
Number of combined Residential & Condominium sales was 1,166
Decrease of -2.8% compared to 1,200 sales in March 2015
Breakdown:
Number of residential sales was 945
o Decrease of -2.9% compared to 973 sales in March 2015
Number of condominium sales was 221
o Decrease of -2.6% compared to 227 sales in March 2015
The 5-year average for the number of March sales is 1,220
* Average sale price of all residential homes, including condominiums was $369,129
Increase of 2% compared to $361,817 in March 2015
Breakdown:
Average Sale Price of residential homes was $394,951
o * Increase of 2% compared to $387,284 in March 2015
Average Sale Price of condominiums was $258,714
o * Increase of 2.4% compared to $252,655 in March 2015
* Average Cumulative Days on Market was 88 (residential and condominium combined)
Increase of 5.7% compared to 83 days on the market in March 2015
Breakdown:
o Cumulative days on Market for residential properties was 85
o Cumulative days on Market for condominium properties was 99
New Listings taken was 3,203 (residential and condominium combined)
Decrease of -5.5% compared to 3,388 new listings taken in March 2015
Breakdown:
New residential listing was 2,443 (2,631 in March 2015)
* New condominium listings was 759 (757 in March 2015)
= Inventory Absorption Rate is 6 months (6 months March 2015)
Breakdown:
Residential absorption rate is 6 months (6 months in March 2015)
Condominium absorption rate is 7 months (9 months in March 2015)
= Sales to Inventory Ratio is 16% (16% in March 2016)
A Balanced Market is 15% to 25%
Breakdown:
Residential sales to inventory ratio is 16% (Balanced Market)
Condominium sales to inventory ratio is 15% (Balanced Market)
Average Sale Price to Average List Price Ratio Combined = 97.8%
[/mp_text]
[/mp_span]
[/mp_row]
